Container rates to America rose while rates to Europe fell, in the same week
Written by

Huan koh
Published on
September 9, 2026

Copy link
Link copied!


What a shipment costs now depends less on the goods than on which way they are pointed.
For most of the last two years, freight cost has been discussed as one number. It went up for everybody, or it came down for everybody. That is no longer what the market looks like. In the week to 7 September 2026, spot rates out of Shanghai rose on both transpacific routes. They fell on both routes into Europe. The gap between the two directions widened rather than closed. A trader shipping to Los Angeles and a trader shipping to Rotterdam now sit in different cost environments, while loading from the same port. On top of that, the Panama Canal cut its daily transit slots on 3 September. That tightened one of the two routes into the American east coast. None of this shows up in a single headline figure. That is why so many costing models are quietly wrong this month.
A container to New York now costs more than twice one to Rotterdam
The absolute numbers are the place to start. The ratio between them is doing more work than the level itself. A trader who knows only that freight has risen this year knows almost nothing useful. What matters is the spread between the lane he ships on and the lane his competitor ships on. That spread is now wide enough to decide a tender on its own.
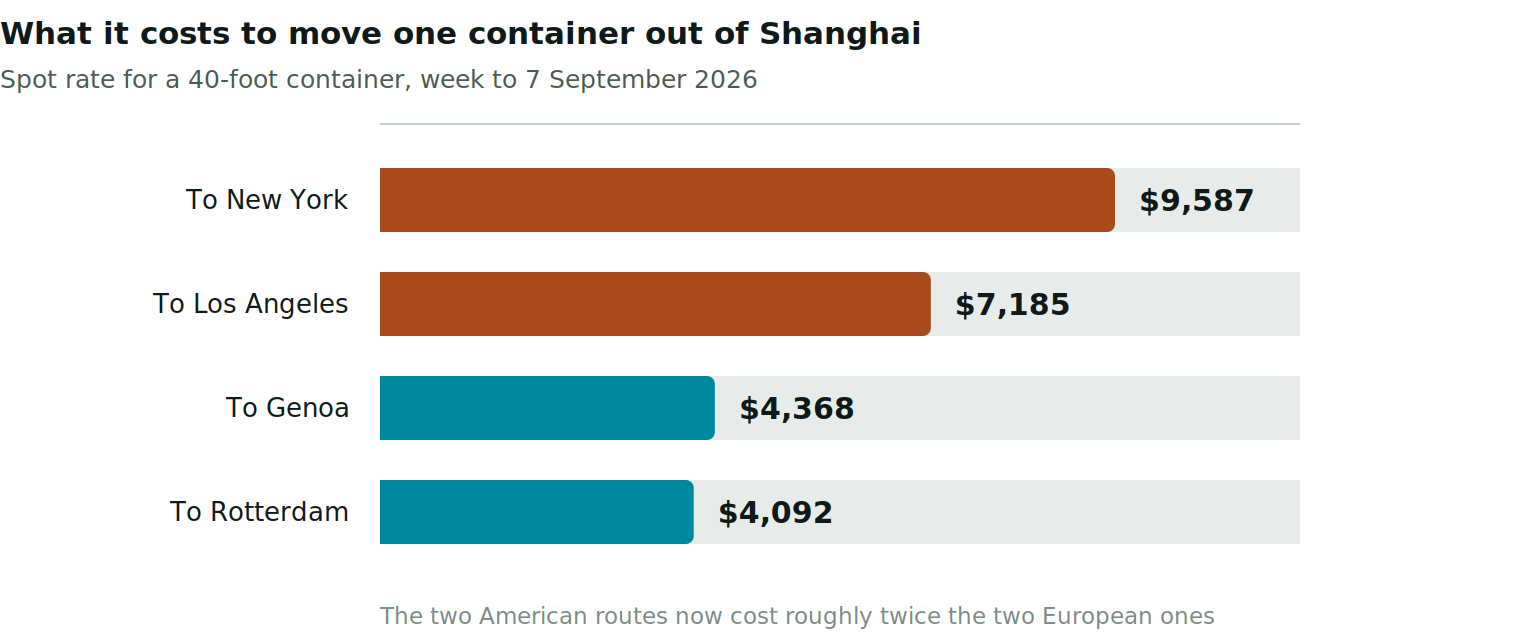
Shanghai to New York stood at US$9,587 for a forty-foot container. Shanghai to Los Angeles was US$7,185. Shanghai to Genoa was US$4,368, and Shanghai to Rotterdam US$4,092. The two American routes cost roughly twice the two European ones. A year ago most traders would have assumed something close to parity. The Asia to Europe voyage carries more days at sea, so on distance alone it ought to cost more. What has changed is not distance but pressure. Demand into the United States is being pulled forward ahead of tariff changes. Capacity into Europe has loosened over the same period. If your pricing applies one global freight rate to every destination, it is now overstating the cost of your European sales. It is understating the cost of your American ones by a wider margin still.
The direction of travel is also splitting, not just the level
The weekly movement matters more than the level for anyone quoting forward. Here the two directions are pulling apart rather than drifting together. A quote is a commitment made at one moment and honoured at another. What sits between those two moments is the rate of change. That rate now differs by lane, which is the part most costing sheets do not capture.
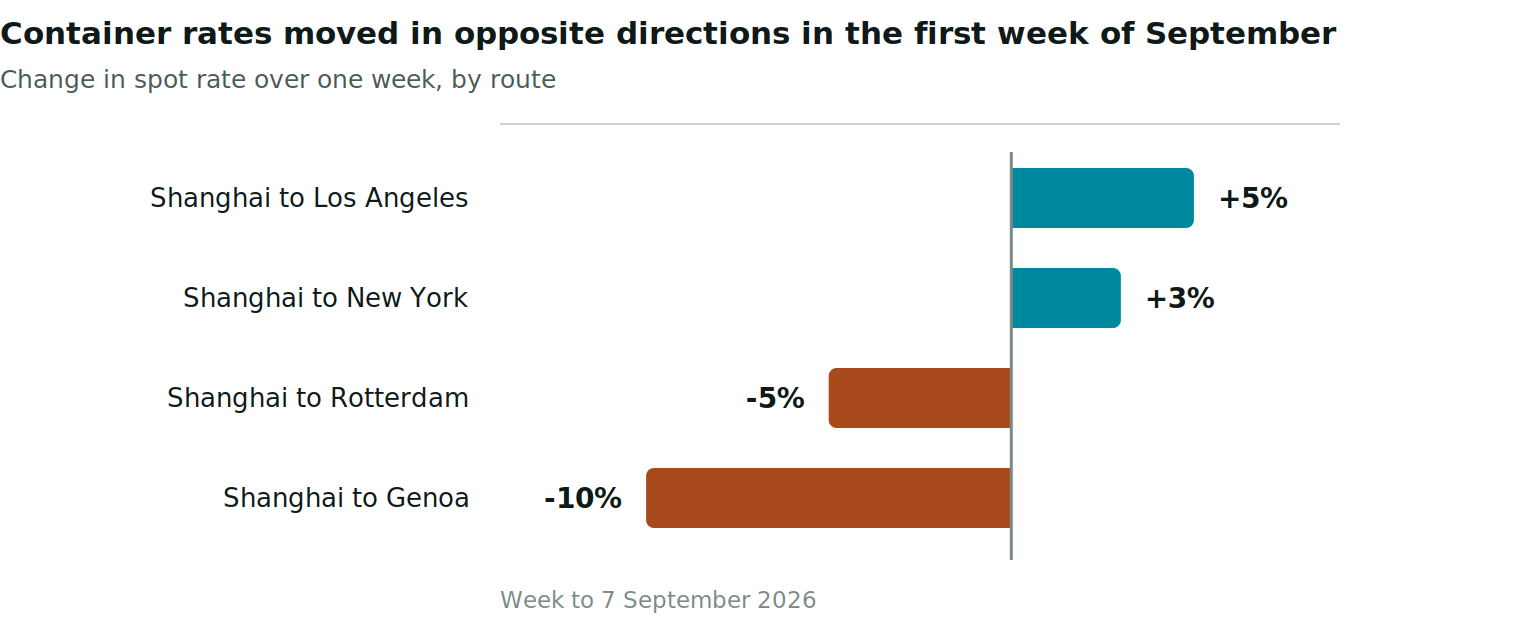
Los Angeles rose 5% in a single week and New York rose 3%. Rotterdam fell 5% and Genoa fell 10%. Broader indices confirm the split rather than contradicting it. The Shanghai Containerized Freight Index rose 2.3% over the same week. The Freightos Baltic index fell 2%. For a buy-sell operator this carries a consequence that is easy to miss. A quote given three weeks ago on a European lane is probably now conservative. The same quote on an American lane is probably now short. If you quote in fixed terms and absorb freight yourself, that difference lands directly on the margin. It also lands unevenly across your customer list rather than uniformly. The customers costing you the most are not the ones you would guess from the invoice values.
The Panama Canal cut its daily slots on 3 September, tightening one of two routes east
Underneath the rate movement sits a physical constraint. It has returned after a quieter period, and it is not the kind that money resolves. The canal is a water problem before it is a shipping problem. When the rain does not come, the locks cannot be filled, and fewer ships can pass through them.
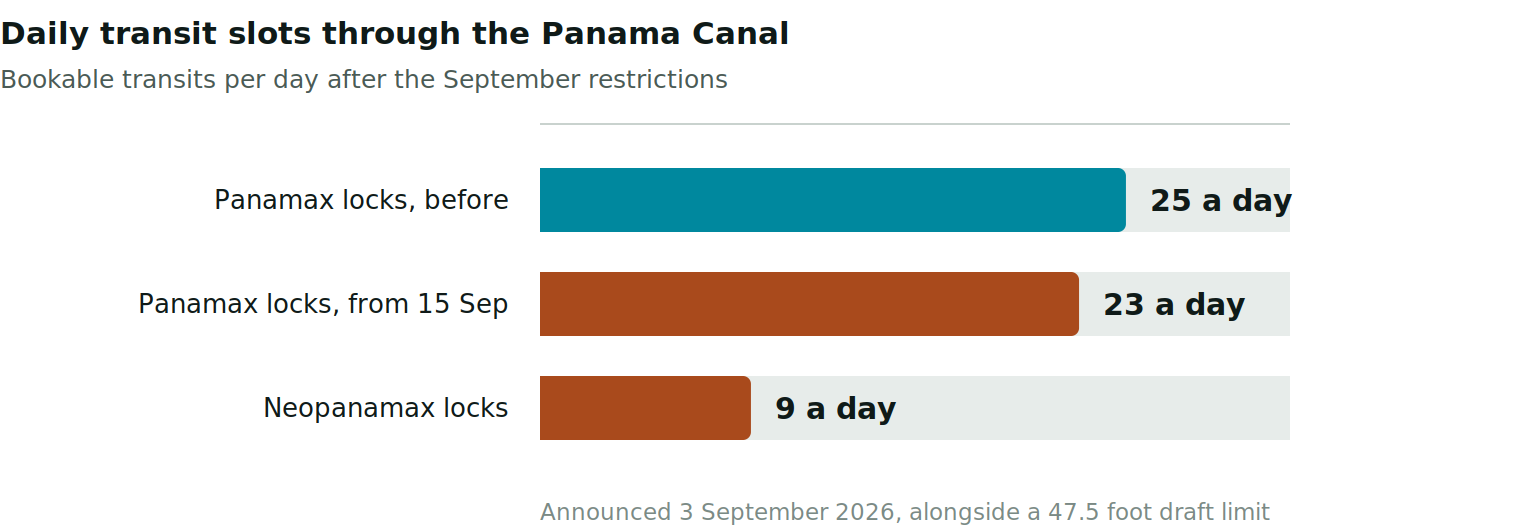
The Panama Canal Authority reduced Neopanamax transits to nine a day. Panamax transits fell to twenty-five, and drop again to twenty-three from 15 September. Maximum draft for the larger vessels was cut to 47.5 feet. Some ships therefore transit lighter than they could otherwise load. The cause is low rainfall in the watershed that feeds the locks. That is a supply problem rather than a demand one. It does not resolve because shippers are willing to pay more. What it does produce is auction pricing for the slots that remain. One reported transit slot sold for US$5.3 million. That is an extreme case rather than a typical cost. It still indicates how scarce the capacity has become, and it is one reason the Shanghai to New York rate sits where it does.
Singapore's July exports rose 24.2%, and the composition matters more than the headline
The same lesson about averages applies to the demand side. Singapore's own trade data makes the point unusually clearly, because the July figures were reported as a triumph. They were a triumph for one industry. For several others the same month was a contraction. Both results were published as a single number, and only the single number travelled.
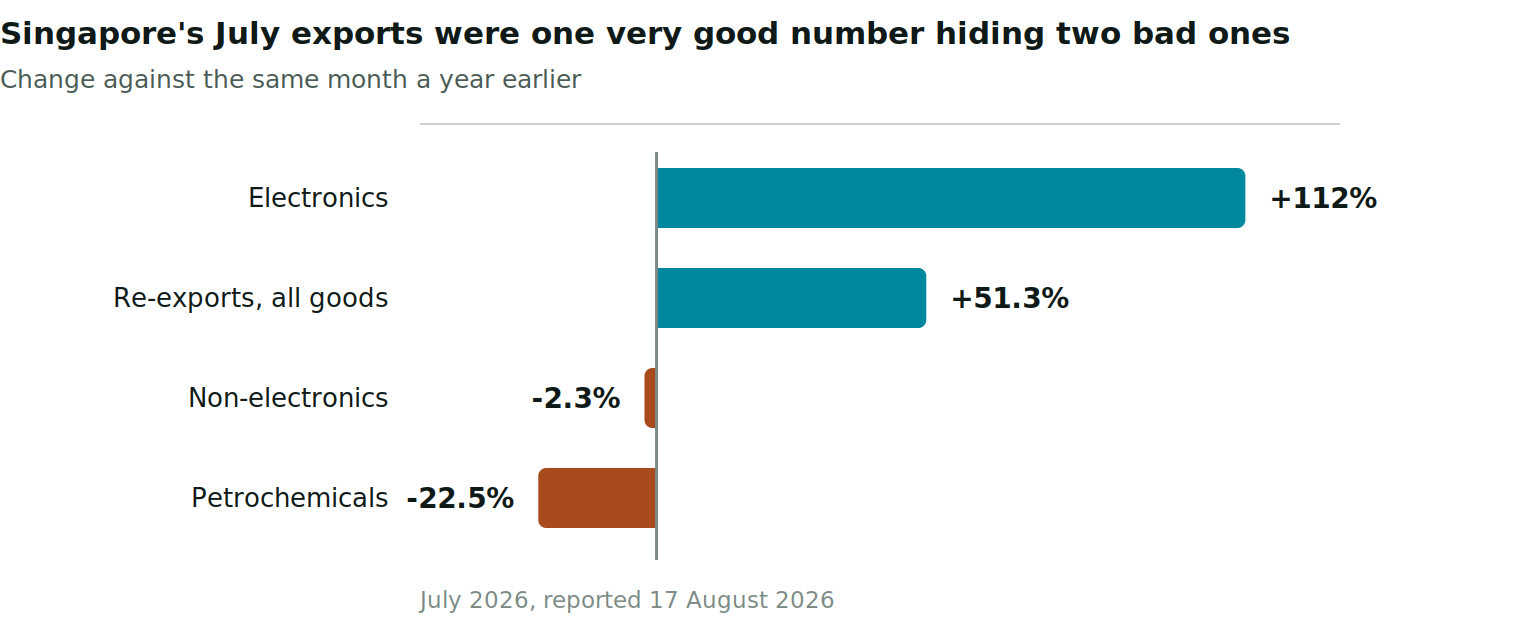
Non-oil domestic exports rose 24.2% against July a year earlier. That reads as a strong month. Underneath it, electronics rose 112% on artificial intelligence demand. Non-electronics fell 2.3% over the same period. Petrochemical exports fell 22.5%, to S$809.6 million, after Middle East disruption led producers on Jurong Island to declare force majeure. Re-exports across all goods rose 51.3%. So one very large category carried the headline while several others contracted underneath it. A trader in electronics and a trader in chemicals both read the same 24.2% figure. Both would be wrong to apply it to their own business. The useful number is almost never the aggregate. The aggregate is almost always the one quoted back at you in a meeting.
What this means for traders shipping to America, traders shipping to Europe, and anyone quoting fixed prices forward
For a trader shipping into the United States, treat freight as a rising input for the next quarter rather than a stable one. Separate your east coast and west coast costings while you are at it. New York at US$9,587 against Los Angeles at US$7,185 is a difference of about a third, on the same box from the same origin. The Panama Canal restrictions make the east coast route the one more likely to tighten further. If you have flexibility on port of entry, the arithmetic currently favours the west coast. Inland haulage may reverse that, depending on where your customer sits. If you have no flexibility at all, build the slot scarcity into your lead times rather than only into your rates. The constraint is on the number of ships that can pass, not on what they are willing to pay.
For a trader shipping into Europe, the current softness is an opportunity that will not announce its own ending. Rotterdam at US$4,092 and Genoa at US$4,368 are both falling week on week. European landed costs are the most favourable they have been in some time relative to the transpacific. If you have been deferring a European customer because the freight maths did not work, run it again this month. The risk in the other direction is straightforward. A rate that falls 10% in a week can rise at a similar pace. Any quote given on today's level should carry a validity period measured in weeks rather than months. The alternative is an explicit freight adjustment clause, which most buyers accept once they see the same indices you are reading.
For anyone quoting fixed prices forward, the structural answer is to stop treating freight as a single number in the model. Hold separate assumptions by lane. Refresh them at least monthly. Make sure the person doing the quoting has the current figure rather than the one that was correct at the last budget. The same discipline applies on the demand side, where a 24.2% headline concealed a 112% rise and a 22.5% fall in the same month. Businesses that survive periods like this are rarely the ones that forecast the direction correctly. They are the ones whose pricing was built to be updated quickly, once the direction turned out to be different for each of their lanes.
Our blog
Latest blog posts
Tools and strategies modern teams need to help their companies grow.